Horizontal cross-section
#!/usr/bin/python
# -*- coding: utf-8 -*-
# ~~~~~~~~~~~~~~~~~~~~~~~~~~~~~~~~~~~~~~~~~~~~~~~~~~~~~~~~~
import numpy as np
import netCDF4
import matplotlib.pyplot as plt
import cartopy.crs as ccrs
# ~~~~~~~~~~~~~~~~~~~~~~~~~~~~~~~~~~~~~~~~~~~~~~~~~~~~~~~~~
# #########################################################
# ### To be defined by user ###
# #########################################################
cfg_file_name = '../data/EXP01.1.SEG01.004diag.nc'
# #########################################################
# ------------------------------------------------------
# Read netcdf file and variables
# ------------------------------------------------------
file_MNH = netCDF4.Dataset(cfg_file_name)
lon_MNH = file_MNH['LON'][1:-1,1:-1]
lat_MNH = file_MNH['LAT'][1:-1,1:-1]
zs_MNH = file_MNH['ZS'][1:-1,1:-1]
uwnd_MNH = file_MNH['ALT_U'][0,0,1:-1,1:-1]
vwnd_MNH = file_MNH['ALT_V'][0,0,1:-1,1:-1]
mask_MNH = uwnd_MNH < -1000.0
uwnd_MNH_masked = np.ma.masked_where(mask_MNH, uwnd_MNH)
vwnd_MNH_masked = np.ma.masked_where(mask_MNH, vwnd_MNH)
wnd_MNH_masked = np.sqrt(uwnd_MNH_masked**2.0+vwnd_MNH_masked**2.0)
# ------------------------------------------------------
# Quick plot
# ------------------------------------------------------
fig = plt.figure(figsize=(6, 6))
ax = plt.axes(projection=ccrs.PlateCarree())
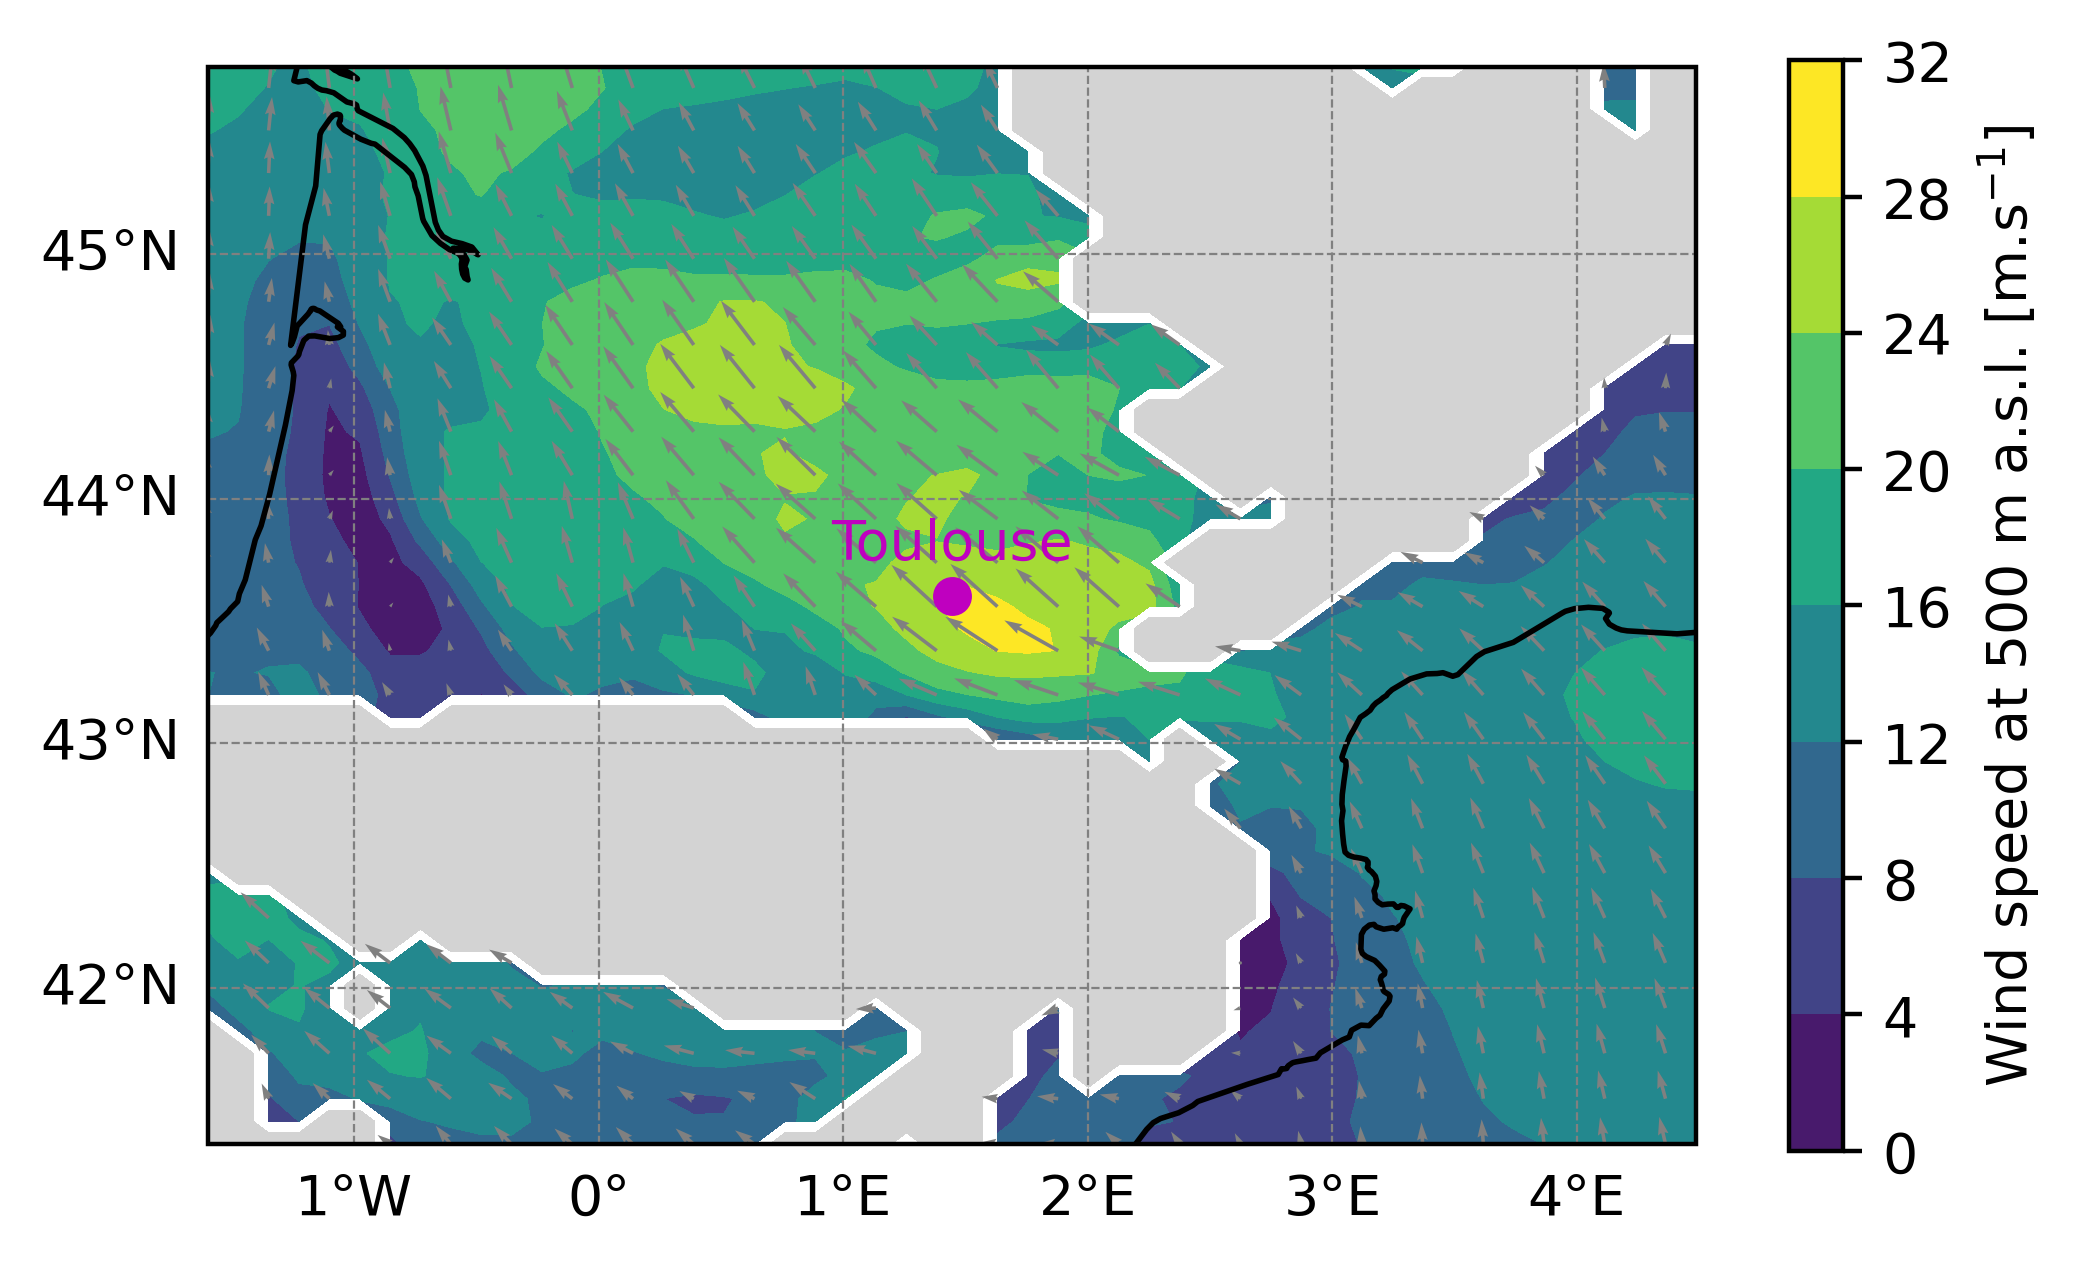
pmsh = ax.contourf(lon_MNH[:,:], lat_MNH[:,:], wnd_MNH_masked[:,:], vmin=0.0, vmax=30.0, shading="auto", cmap="viridis")
ax.contourf(lon_MNH[:,:], lat_MNH[:,:], mask_MNH[:,:], levels=[0.5, 1], colors='lightgray')
qvr = ax.quiver(lon_MNH[::2, ::2], lat_MNH[::2, ::2], uwnd_MNH_masked[::2, ::2], vwnd_MNH_masked[::2, ::2], color="gray")
# ------------------------------------------------------
# Some adjustments to the plot
# ------------------------------------------------------
gl = ax.gridlines(draw_labels=True, linewidth=0.4, color='gray', linestyle='--')
gl.top_labels = False
gl.right_labels = False
ax.coastlines()
cbar=plt.colorbar(pmsh,shrink=0.59)
cbar.set_label(r"Wind speed at 500 m a.s.l. [m.s$^{-1}$]")
ax.plot(1.444, 43.604, marker='o', color='m', markersize=6)
ax.text(1.444, 43.604+0.1, "Toulouse", color='m', fontsize=10, ha='center', va='bottom')
plt.savefig('plot_horizontal_cross_section.png', bbox_inches='tight', dpi=400)