LnameFiles = ['FIRE_.1.CEN4T.000.nc' ]
LG_MEAN = '/LES_budgets/Mean/Cartesian/Not_time_averaged/Not_normalized/cart/'
Dvar_input = {
'f1':[(LG_MEAN,'MEAN_RC'), (LG_MEAN,'MEAN_RR'), (LG_MEAN,'MEAN_U'),
(LG_MEAN,'MEAN_V'), (LG_MEAN,'MEAN_W'), (LG_MEAN,'MEAN_THL'),
'time_les','level_les']
}
# Read the variables in the files
Dvar = {}
Dvar = read_netcdf(LnameFiles, Dvar_input, path=path, removeHALO=False)
Panel1 = PanelPlot(2,3, [25,14],'', titlepad=25, minmaxpad=1.04, timepad=-0.07, colorbarpad=0.03, labelcolorbarpad = 13, colorbaraspect=40)
Lplot = [Dvar['f1'][(LG_MEAN,'MEAN_RC')][:,180:], Dvar['f1'][(LG_MEAN,'MEAN_RR')][:,180:],Dvar['f1'][(LG_MEAN,'MEAN_U')][:,180:],
Dvar['f1'][(LG_MEAN,'MEAN_V')][:,180:], Dvar['f1'][(LG_MEAN,'MEAN_W')][:,180:], Dvar['f1'][(LG_MEAN,'MEAN_THL')][:,180:]]
LaxeX = [Dvar['f1']['time_les'][180:]/3600.]*len(Lplot)
LaxeZ = [Dvar['f1']['level_les']]*len(Lplot)
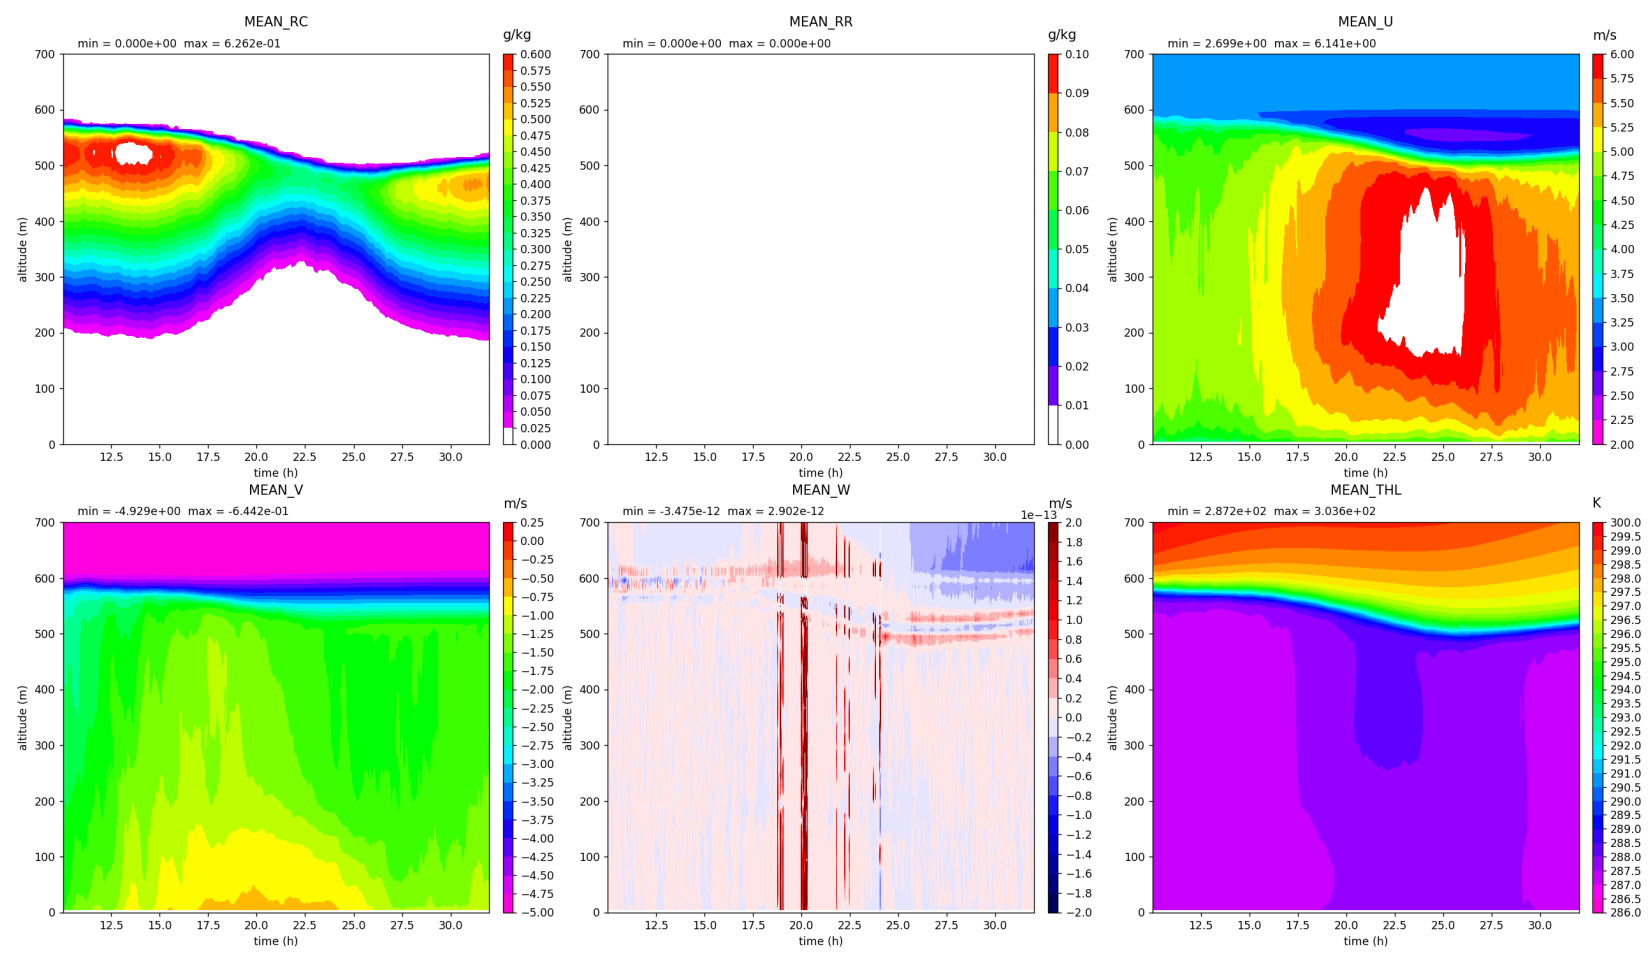
Ltitle = ['MEAN_RC', 'MEAN_RR','MEAN_U', 'MEAN_V','MEAN_W','MEAN_THL']
Lcbarlabel = ['g/kg', 'g/kg' ,'m/s' ,'m/s', 'm/s', 'K']
Lxlab = ['time (h)']*len(Lplot)
Lylab = ['altitude (m)']*len(Lplot)
Lylim = [(0,700)]*len(Lplot)
Lminval = [0, 0, 2, -5, -0.2E-12, 286]
Lmaxval = [0.62, 0.1, 6, 0.25, 0.2E-12, 300]
Lstep = [0.025, 0.01, 0.25, 0.25, 0.2E-13,0.5 ]
Lstepticks = Lstep
Lfacconv = [1000, 1000, 1, 1, 1, 1]
Lcolormap = ['gist_rainbow_r', 'gist_rainbow_r', 'gist_rainbow_r', 'gist_rainbow_r', 'seismic','gist_rainbow_r']
LaddWhite = [True, True, False, False, False, False]
fig1 = Panel1.psectionV(Lxx=LaxeX, Lzz=LaxeZ, Lvar=Lplot, Lxlab=Lxlab, Lylab=Lylab, Ltitle=Ltitle, Lminval=Lminval, Lmaxval=Lmaxval,
Lstep=Lstep, Lstepticks=Lstepticks, Lcolormap=Lcolormap, Lcbarlabel=Lcbarlabel, Lfacconv=Lfacconv,
LaddWhite_cm=LaddWhite, Lylim=Lylim)
Panel1.save_graph(1,fig1)