#!/usr/bin/env python3
"""
@author: Quentin Rodier
Creation : 07/01/2021
Last modifications
"""
import matplotlib as mpl
mpl.use('Agg')
from read_MNHfile import read_netcdf
from Panel_Plot import PanelPlot
from misc_functions import comp_altitude2DVar, oblique_proj, windvec_verti_proj, mean_operator
import math
import os
os.system('rm -f tempgraph*')
#
# User's parameter / Namelist
#
path=""
LnameFiles = ['KWRAI.1.SEG01.004.nc','KWRAI.1.SEG01.004dia.nc' ]
Dvar_input = {
'f1':['ZS', 'UT','VT', 'WT','THT',
'ni_u','nj_u','level','ZTOP', 'ni','nj','level_w','time',
'INPRR','ACPRR','PABST','RCT','RVT','RRT','LSTHM'],
'f2':['ALT_CLOUD', 'ALT_U', 'ALT_V', 'ni','nj']}
# Read the variables in the files
Dvar = {}
Dvar = read_netcdf(LnameFiles, Dvar_input, path=path, removeHALO=True)
################################################################
######### PANEL 1
###############################################################
Panel1 = PanelPlot(2,3, [25,14],'', titlepad=25, minmaxpad=1.04, timepad=-0.07, colorbarpad=0.01)
Lplot = [ Dvar['f1']['INPRR'], Dvar['f1']['ACPRR'], Dvar['f1']['PABST'],Dvar['f2']['ALT_CLOUD'],Dvar['f2']['ALT_CLOUD'] ]
LaxeX = [Dvar['f1']['ni']]*len(Lplot)
LaxeY = [Dvar['f1']['nj']]*len(Lplot)
Ltitle = ['Instantaneous precipitation INPRR', 'Accumulated precipitation ACPRR','Absolute pressure','Mixing ratio of liquid droplets at z=3000m','Mixing ratio of liquid droplets at z=5000m' ]
Lcbarlabel = ['mm/h', 'mm','hPa','g/kg','g/kg']
Lxlab = ['x (m)']*len(Lplot)
Lylab = ['y (m)']*len(Lplot)
Lminval = [0, 0, 982.25, 0, 0]
Lmaxval = [6.25, 0.15, 983.55, 3.0, 3.0]
Lstep = [0.25, 0.005, 0.05, 0.05, 0.05]
Lstepticks = [0.5, 0.02, 0.2, 0.5, 0.5]
Lfacconv = [1, 1, 1./100.0,1,1]
Lcolormap = ['gist_ncar_r']*len(Lplot)
Llvl = [0,0,0,0,1]
Ltime = [Dvar['f1']['time']]*len(Lplot)
LaddWhite = [True]*len(Lplot)
Lpltype = ['cf']*len(Lplot)
fig1 = Panel1.psectionH(lon=LaxeX, lat=LaxeY, Lvar=Lplot, Llevel=Llvl, Lxlab=Lxlab, Lylab=Lylab, Ltitle=Ltitle, Lminval=Lminval, Lmaxval=Lmaxval,
Lstep=Lstep, Lstepticks=Lstepticks, Lcolormap=Lcolormap, Lcbarlabel=Lcbarlabel, Lfacconv=Lfacconv,
Ltime=Ltime, LaddWhite_cm=LaddWhite)
fig1.tight_layout()
# Wind vectors
Lplot1 = [ Dvar['f1']['UT'], Dvar['f2']['ALT_U'], Dvar['f2']['ALT_U']]
Lplot2 = [ Dvar['f1']['VT'], Dvar['f2']['ALT_V'], Dvar['f2']['ALT_V']]
Ltitle = ['Wind at K=2', 'Wind at 3000m', 'Wind at 5000m']
Lxlab = ['x (m)']*len(Lplot)
Lylab = ['y (m)']*len(Lplot)
Llegendval = [10,10,10]
Lcbarlabel = ['m/s']*len(Lplot)
Larrowstep = [1]*len(Lplot)
Lwidth = [0.002]*len(Lplot)
Lcolor = ['black']*len(Lplot)
Llvl = [0,0,1]
lon = [Dvar['f1']['ni_u'], Dvar['f2']['ni'], Dvar['f2']['ni'] ]
lat = [Dvar['f1']['nj_u'], Dvar['f2']['nj'], Dvar['f2']['nj'] ]
Lscale = [200]*len(Lplot)
fig2 = Panel1.pvector(Lxx=lon, Lyy=lat, Lvar1=Lplot1, Lvar2=Lplot2, Lcarte=[500,23500,500,23500], Llevel=Llvl,
Lxlab=Lxlab, Lylab=Lylab, Ltitle=Ltitle, Lwidth=Lwidth, Larrowstep=Larrowstep,
Lcolor=Lcolor, Llegendval=Llegendval, Lcbarlabel=Lcbarlabel, Lid_overlap=[4,6,8], ax=fig1.axes, Lscale=Lscale)
# Oblique projection
i_beg, j_beg = (3,0)
i_end, j_end = (22,21)
# Black line
Panel1.addLine(fig2.axes[6],[Dvar['f1']['ni'][i_beg],Dvar['f1']['nj'][j_beg]],[Dvar['f1']['ni'][i_end],Dvar['f1']['nj'][j_end]],'black',2)
Panel1.save_graph(1,fig2)
################################################################
######### PANEL 2 : Oblique projection
###############################################################
Panel2 = PanelPlot(2,2, [17,17],'Oblique section (angle = 47)', titlepad=25, minmaxpad=1.04, timepad=-0.07, colorbarpad=0.01, lateralminmaxpad=0.97)
Dvar['f1']['THT-LSTHM'] = Dvar['f1']['THT'] - Dvar['f1']['LSTHM']
tomass = mean_operator()
Dvar['f1']['UM'] = tomass.MXM(Dvar['f1']['UT'])
Dvar['f1']['VM'] = tomass.MYM(Dvar['f1']['VT'])
Dvar['f1']['WM'] = tomass.MZM(Dvar['f1']['WT'])
angle_sec1, RVT_sec1, axe_m1 = oblique_proj(Dvar['f1']['RVT'], Dvar['f1']['ni'], Dvar['f1']['nj'], Dvar['f1']['level'], i_beg, j_beg, i_end, j_end)
WIND_proj = windvec_verti_proj(Dvar['f1']['UM'], Dvar['f1']['VM'], Dvar['f1']['level'], angle_sec1)
angle_sec1, WIND_sec1, axe_m1 = oblique_proj(WIND_proj, Dvar['f1']['ni'], Dvar['f1']['nj'], Dvar['f1']['level'], i_beg, j_beg, i_end, j_end)
angle_sec1, WT_sec1, axe_m1 = oblique_proj(Dvar['f1']['WM'], Dvar['f1']['ni'], Dvar['f1']['nj'], Dvar['f1']['level'], i_beg, j_beg, i_end, j_end)
angle_sec1, RCT_sec1, axe_m1 = oblique_proj(Dvar['f1']['RCT'], Dvar['f1']['ni'], Dvar['f1']['nj'], Dvar['f1']['level'], i_beg, j_beg, i_end, j_end)
angle_sec1, RRT_sec1, axe_m1 = oblique_proj(Dvar['f1']['RRT'], Dvar['f1']['ni'], Dvar['f1']['nj'], Dvar['f1']['level'], i_beg, j_beg, i_end, j_end)
angle_sec1, anoTHT_sec1, axe_m1 = oblique_proj(Dvar['f1']['THT-LSTHM'], Dvar['f1']['ni'], Dvar['f1']['nj'], Dvar['f1']['level'], i_beg, j_beg, i_end, j_end)
Lplot = [RVT_sec1, RCT_sec1, anoTHT_sec1, WT_sec1]
LaxeX = [axe_m1]*len(Lplot)
LaxeZ = [Dvar['f1']['level'], Dvar['f1']['level'], Dvar['f1']['level'],Dvar['f1']['level_w']]
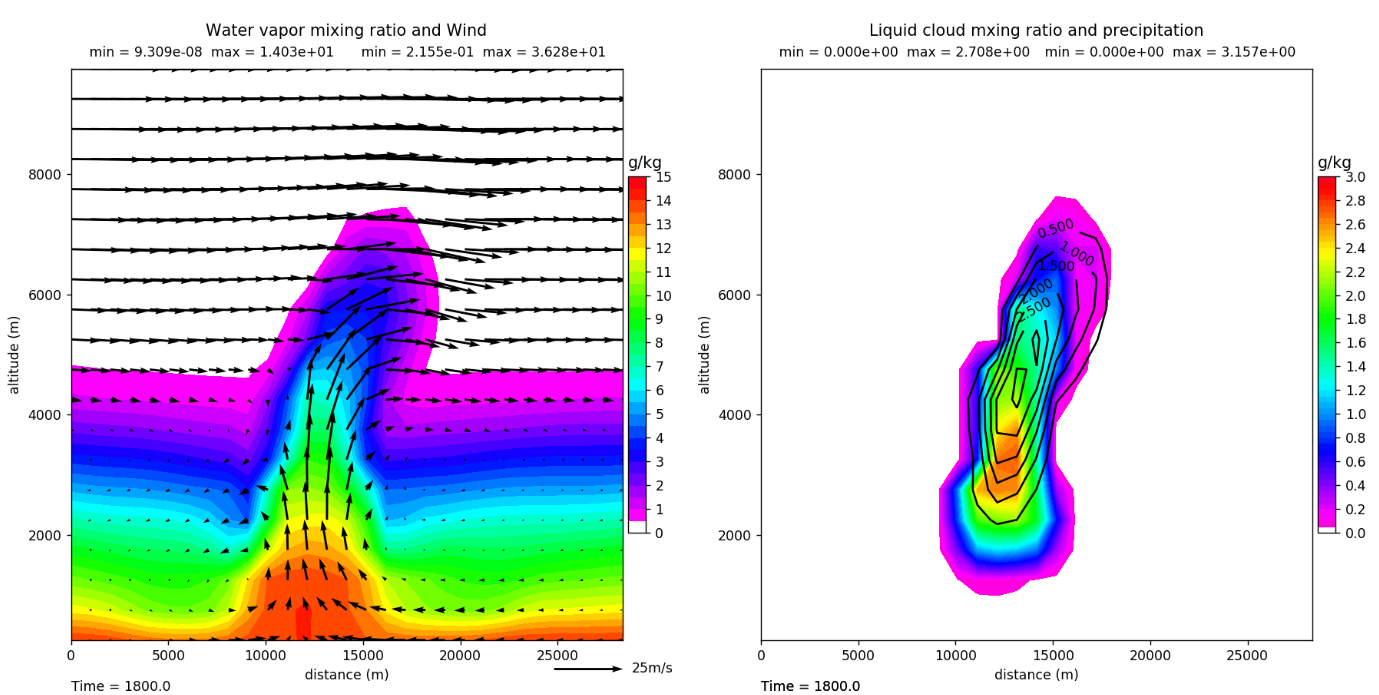
Ltitle = ['Water vapor mixing ratio', 'Liquid cloud mxing ratio', 'Potential temperature anomaly', 'Vertical velocity']
Lcbarlabel = ['g/kg','g/kg', 'K', 'm/s']
Lxlab = ['distance (m)']*len(Lplot)
Lylab = ['altitude (m)']*len(Lplot)
Lminval = [0., 0., -5, -18]
Lmaxval = [15, 3.0, 5, 18]
Lstep = [0.5, 0.05, 0.2, 0.5]
Lstepticks = [1, 0.2, 1, 2.5]
Lfacconv = [1000, 1000, 1, 1]
Lcolormap = ['gist_rainbow_r','gist_rainbow_r', 'seismic','seismic']
Ltime = [Dvar['f1']['time']]*len(Lplot)
Lpltype = ['cf']*len(Lplot)
LaddWhite = [True, True, False, False]
fig3 = Panel2.psectionV(Lxx=LaxeX, Lzz=LaxeZ, Lvar=Lplot, Lxlab=Lxlab, Lylab=Lylab, Ltitle=Ltitle, Lminval=Lminval, Lmaxval=Lmaxval,
Lstep=Lstep, Lstepticks=Lstepticks, Lcolormap=Lcolormap, Lcbarlabel=Lcbarlabel, Lfacconv=Lfacconv,
Ltime=Ltime, Lpltype=Lpltype, LaddWhite_cm=LaddWhite)
Lplot1 = [ WIND_sec1]
Lplot2 = [ WT_sec1]
Ltitle = ['Wind']
Llegendval = [25]
Lcbarlabel = ['m/s']*len(Lplot)
Larrowstep = [1]*len(Lplot)
Lwidth = [0.004]*len(Lplot)
Lscale = [200]*len(Lplot)
fig4 = Panel2.pvector(Lxx=LaxeX, Lyy=LaxeZ, Lvar1=Lplot1, Lvar2=Lplot2, Lxlab=Lxlab, Lylab=Lylab, Ltitle=Ltitle, Lwidth=Lwidth, Larrowstep=Larrowstep,
Llegendval=Llegendval, Lcbarlabel=Lcbarlabel, Lid_overlap=[0], ax=fig3.axes, Lscale=Lscale)
Lplot = [RRT_sec1]
LaxeX = [axe_m1]
LaxeZ = [Dvar['f1']['level']]
Ltitle = ['precipitation']
Lcbarlabel = ['g/kg']*len(Lplot)
Lxlab = ['distance (m)']*len(Lplot)
Lylab = ['altitude (m)']*len(Lplot)
Lylim = [(0,10000.1)]*len(Lplot)
Lminval = [0.]
Lmaxval = [3.5]
Lstep = [0.5]
Lstepticks = [0.5]
Lfacconv = [1000]*len(Lplot)
LcolorLine = ['black']*len(Lplot)
Llvl = [0]*len(Lplot)
Ltime = [Dvar['f1']['time']]
Lpltype = ['c']*len(Lplot)
LaddWhite = [True]*len(Lplot)
fig5 = Panel2.psectionV(Lxx=LaxeX, Lzz=LaxeZ, Lvar=Lplot, Lxlab=Lxlab, Lylab=Lylab, Ltitle=Ltitle, Lminval=Lminval, Lmaxval=Lmaxval,
Lstep=Lstep, Lstepticks=Lstepticks, LcolorLine=LcolorLine, Lcbarlabel=Lcbarlabel, Lfacconv=Lfacconv,
Ltime=Ltime, Lpltype=Lpltype, LaddWhite_cm=LaddWhite, ax=fig4.axes,Lid_overlap=[2],colorbar=False)
Panel2.save_graph(2,fig5)
################################################################
######### PANEL 3
###############################################################
Panel3 = PanelPlot(2,2, [17,17],'Vertical section along y at I=14', titlepad=25, minmaxpad=1.04, timepad=-0.07, colorbarpad=0.01, lateralminmaxpad=0.97)
Lplot = [Dvar['f1']['RVT'][:,:,13], Dvar['f1']['RCT'][:,:,13], Dvar['f1']['THT-LSTHM'][:,:,13], Dvar['f1']['WT'][:,:,13]]
LaxeX = [Dvar['f1']['nj']]*len(Lplot)
LaxeZ = [Dvar['f1']['level'], Dvar['f1']['level'], Dvar['f1']['level'],Dvar['f1']['level_w']]
Ltitle = ['Water vapor mixing ratio', 'Liquid cloud mxing ratio', 'Potential temperature anomaly', 'Vertical velocity']
Lcbarlabel = ['g/kg','g/kg', 'K', 'm/s']
Lxlab = ['distance (m)']*len(Lplot)
Lylab = ['altitude (m)']*len(Lplot)
Lminval = [0., 0., -5, -18]
Lmaxval = [15, 3.0, 5, 18]
Lstep = [0.5, 0.05, 0.2, 0.5]
Lstepticks = [1, 0.2, 1, 2.5]
Lfacconv = [1000, 1000, 1, 1]
Lcolormap = ['gist_rainbow_r','gist_rainbow_r', 'seismic','seismic']
Ltime = [Dvar['f1']['time']]*len(Lplot)
Lpltype = ['cf']*len(Lplot)
LaddWhite = [True, True, False, False]
fig6 = Panel3.psectionV(Lxx=LaxeX, Lzz=LaxeZ, Lvar=Lplot, Lxlab=Lxlab, Lylab=Lylab, Ltitle=Ltitle, Lminval=Lminval, Lmaxval=Lmaxval,
Lstep=Lstep, Lstepticks=Lstepticks, Lcolormap=Lcolormap, Lcbarlabel=Lcbarlabel, Lfacconv=Lfacconv,
Ltime=Ltime, Lpltype=Lpltype, LaddWhite_cm=LaddWhite)
Lplot1 = [ Dvar['f1']['VM'][:,:,13]]
Lplot2 = [ Dvar['f1']['WM'][:,:,13]]
Ltitle = ['Wind']
Llegendval = [25]
Lcbarlabel = ['m/s']*len(Lplot)
Larrowstep = [1]*len(Lplot)
Lwidth = [0.004]*len(Lplot)
Lscale = [200]*len(Lplot)
fig7 = Panel3.pvector(Lxx=LaxeX, Lyy=LaxeZ, Lvar1=Lplot1, Lvar2=Lplot2, Lxlab=Lxlab, Lylab=Lylab, Ltitle=Ltitle, Lwidth=Lwidth, Larrowstep=Larrowstep,
Llegendval=Llegendval, Lcbarlabel=Lcbarlabel, Lid_overlap=[0], ax=fig6.axes, Lscale=Lscale)
Lplot = [Dvar['f1']['RRT'][:,:,13]]
Ltitle = ['precipitation']
Lcbarlabel = ['g/kg']*len(Lplot)
Lxlab = ['distance (m)']*len(Lplot)
Lylab = ['altitude (m)']*len(Lplot)
Lylim = [(0,10000.1)]*len(Lplot)
Lminval = [0.]
Lmaxval = [3.5]
Lstep = [0.5]
Lstepticks = [0.5]
Lfacconv = [1000]*len(Lplot)
LcolorLine = ['black']*len(Lplot)
Llvl = [0]*len(Lplot)
Ltime = [Dvar['f1']['time']]
Lpltype = ['c']*len(Lplot)
LaddWhite = [True]*len(Lplot)
fig8 = Panel3.psectionV(Lxx=LaxeX, Lzz=LaxeZ, Lvar=Lplot, Lxlab=Lxlab, Lylab=Lylab, Ltitle=Ltitle, Lminval=Lminval, Lmaxval=Lmaxval,
Lstep=Lstep, Lstepticks=Lstepticks, LcolorLine=LcolorLine, Lcbarlabel=Lcbarlabel, Lfacconv=Lfacconv,
Ltime=Ltime, Lpltype=Lpltype, LaddWhite_cm=LaddWhite, ax=fig7.axes,Lid_overlap=[2],colorbar=False)
Panel3.save_graph(3,fig8)