Panel6 = PanelPlot(2,2, [20,20],'Profiles at the center (top of the topography)')
Lplot = [ Dvar['f1']['WT'][:,127]]
LaxeZ = [Dvar['f1']['altitude'][:,127]]*len(Lplot)
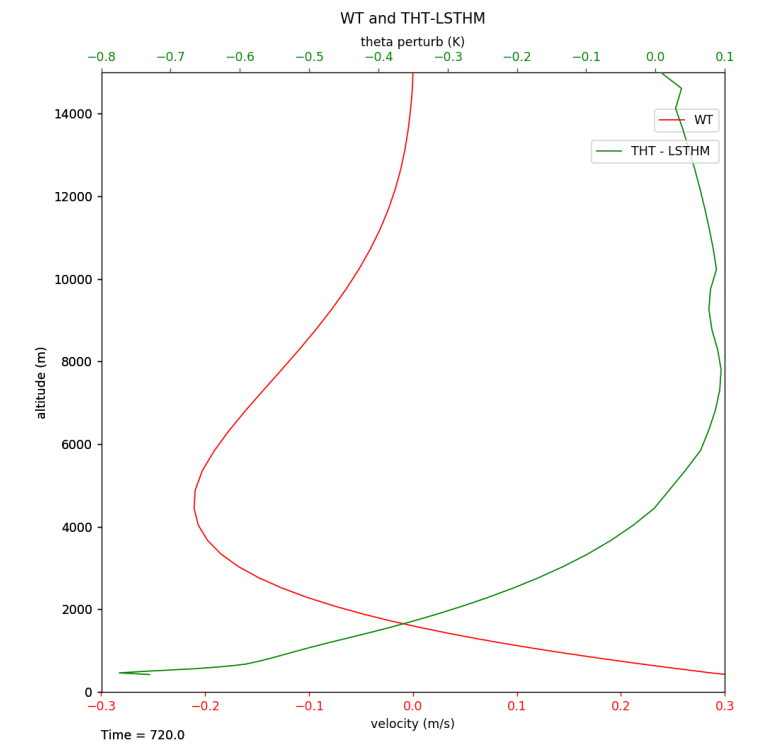
Ltitle = ['WT and THT-LSTHM']*len(Lplot)
Llinelabel = ['WT']
Lxlab = ['velocity (m/s)']*len(Lplot)
Lylab = ['altitude (m)']*len(Lplot)
Lylim = [(0,15000.1)]*len(Lplot)
Lxlim = [(-0.3,0.3)]
Llinecolor = ['r']
LaxisColor = Llinecolor
Llvl = [0]*len(Lplot)
Ltime = [Dvar['f1']['time']]
fig6 = Panel6.pXY_lines(Lyy=LaxeZ, Lxx=Lplot, Lxlab=Lxlab, Lylab=Lylab, Ltitle=Ltitle, Lylim=Lylim, Lxlim=Lxlim, Llinelabel=Llinelabel,
Llinecolor=Llinecolor, LaxisColor=LaxisColor, Ltime=Ltime)
Lplot = [ Dvar['f1']['THT-LSTHM'][:,127]]
Ltitle = []
Llinelabel = ['THT - LSTHM ']
Lxlab = ['theta perturb (K)']*len(Lplot)
Lylab = ['altitude (m)']*len(Lplot)
Lylim = [(0,15000.1)]*len(Lplot)
Lxlim = [(-0.8,0.1)]
Llinecolor = ['g']
LaxisColor = Llinecolor
Llvl = [0]*len(Lplot)
fig7 = Panel6.pXY_lines(Lyy=LaxeZ, Lxx=Lplot, Lxlab=Lxlab, Lylab=Lylab, Ltitle=Ltitle,ax=fig6.axes, id_overlap=1,
Lylim=Lylim, Lxlim=Lxlim, Llinelabel=Llinelabel, Llinecolor=Llinecolor,LaxisColor=LaxisColor, Ltime=Ltime)